距离上一个项目实践已经过去了 38 天,又把 Python 忘记的差不多了,囧。。
第二个项目比较容易,Python 作为分析工具是一把利器,通常去分析数据的时候,Python 实现的功能大致上有:
- 从网络中下载数据文件
- 对数据文件进行解析,并提取感兴趣的内容
- 根据提取的数据创建 PDF 图形
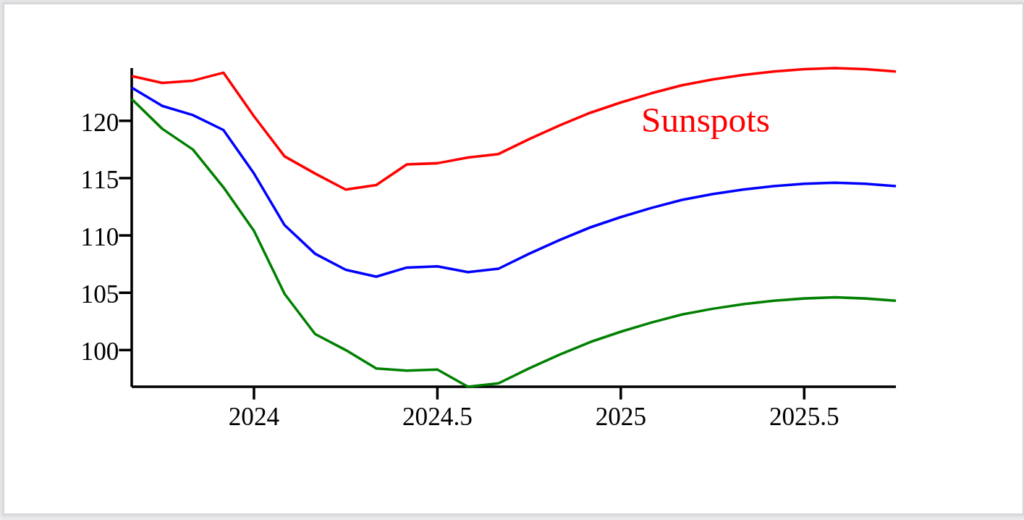
项目是通过 ReportLab 库来绘制太阳黑子的数据图,可惜网上数据源链接已经过期,不提供 txt 数据源,而是提供 JSON 文件,虽然对 JSON 处理也很容易,但还是简单的在本地创建了一个 Predict.txt 文件,然后通过访问本地文件的方式来获取数据。
#: demo data
2023 08    122.9   123.9   121.9   156.4   157.4   155.4
2023 09    121.3   123.3   119.3   153 154 152
2023 10    120.5   123.5   117.5   150.8   152.8   148.8
2023 11    119.2   124.2   114.2   148.7   151.7   145.7
2023 12    115.4   120.4   110.4   146.1   150.1   142.1
2024 01    110.9   116.9   104.9   142.7   146.7   138.7
2024 02    108.4   115.4   101.4   139.8   144.8   134.8
2024 03    107 114 100 137.8   146.8   128.8
2024 04    106.4   114.4   98.4    136.4   145.4   127.4
2024 05    107.2   116.2   98.2    135.1   144.1   126.1
2024 06    107.3   116.3   98.3    133.2   142.2   124.2
2024 07    106.8   116.8   96.8    130.9   139.9   121.9
2024 08    107.1   117.1   97.1    130.1   139.1   121.1
2024 09    108.4   118.4   98.4    131 140 122
2024 10    109.6   119.6   99.6    131.9   140.9   122.9
2024 11    110.7   120.7   100.7   132.6   141.6   123.6
2024 12    111.6   121.6   101.6   133.3   142.3   124.3
2025 01    112.4   122.4   102.4   133.8   142.8   124.8
2025 02    113.1   123.1   103.1   134.3   143.3   125.3
2025 03    113.6   123.6   103.6   134.7   143.7   125.7
2025 04    114 124 104 135 144 126
2025 05    114.3   124.3   104.3   135.2   144.2   126.2
2025 06    114.5   124.5   104.5   135.3   144.3   126.3
2025 07    114.6   124.6   104.6   135.4   144.4   126.4
2025 08    114.5   124.5   104.5   135.3   144.3   126.3
2025 09    114.3   124.3   104.3   135.2   144.2   126.2
由于对使用 Python 进行绘图并不感冒,所以 ReportLab 只是浅尝,但是对提取数据感兴趣。
from urllib.request import urlopen
from reportlab.graphics.shapes import *
from reportlab.graphics.charts.lineplots import LinePlot
from reportlab.graphics.charts.textlabels import Label
from reportlab.graphics import renderPDF

URL = 'ftp://ftp.swpc.noaa.gov/pub/weekly/Predict.txt'
COMMENT_CHARS = '#:'


drawing = Drawing(400, 200)
data = []
with open('Predict.txt') as f:
    for line in f.readlines():
        #line = line.decode()
        if not line.isspace() and line[0] not in COMMENT_CHARS:
            data.append([float(n) for n in line.split()])

pred = [row[2] for row in data]
high = [row[3] for row in data]
low = [row[4] for row in data]
times = [row[0] + row[1]/12.0 for row in data]

lp = LinePlot()
lp.x = 50
lp.y = 50
lp.height = 125
lp.width = 300
lp.data = [list(zip(times, pred)),
           list(zip(times, high)),
           list(zip(times, low))]
lp.lines[0].strokeColor = colors.blue
lp.lines[1].strokeColor = colors.red
lp.lines[2].strokeColor = colors.green

drawing.add(lp)

drawing.add(String(250, 150, 'Sunspots',
            fontSize=14, fillColor=colors.red))


renderPDF.drawToFile(drawing, 'report2.pdf', 'Sunspots')
实验时,误使用了 f.readline() 方法,导致返回的是一行内容,要实现获取整个内容,且每一行作为列表中的项目,应该使用 f.readlines() 方法。
执行后,获得的 report2.pdf 内容: